YouTube user TheHomeScientist (via In The Pipeline) is posting a series of videos about what you can do in a home chemistry lab; as a nice example, there's this beautiful one about the purification of hydrochloric acid:
Isn't this method elegant? No complicated boiling or fumbling around with strong acids; just take advantage of the fact that HCl is a gas.
I think it's great to show people that you can really do chemistry at home. Science is not just the domain of white men in white coats with PhDs. On the other hand, I'm hesitant to get too ecstatic about how "democratic" this is. Not just anyone can afford the time, energy, and space to set up a lab like this.
Parmesan oregano bread
This is a very tasty bread that's rich enough to eat by itself, rather than as a substrate for some more flavourful substance. It also smells wonderful:
- 300 mL water
- 50 mL sugar
- 15 mL oregano
- 250 mL grated parmesan (or romano)
- 5 mL salt
- 750 mL white flour
- 20 mL olive oil
- 10 mL yeast
I brought this to our neutron star discussion group and it was a hit.
Full post
Labels:
note to self,
recipe
Gallium surface gunge
Gallium, as a safer liquid metal than mercury, has two major drawbacks: the surface rapidly acquires a layer of dull oxides, and when in contact with surfaces it tends to leave a thin layer behind. I've been doing some reading to see if I can work around this problem, and I came across this enjoyable article (which may be behind a paywall).
Full post
Labels:
do it yourself,
gallium,
science
Digital: A Love Story
For those of us who remember the days of BBSes and 2400-baud modems, Digital: A Love Story has considerable charm. It's a game in a genre — ren'ai — with some conventions that take some getting used to, but it's clever and original enough to be fun even if you weren't using computers in 1988 and haven't played ren'ai before. Recommended.
(It's also in python, using a framework, renpy, that has been a major success.)
Full post
Labels:
entertainment,
game,
python,
retrocomputing
Real interbinning
(This is another of my highly-technical "note to self" signal processing posts. I'll put up something less arcane soon.)
The Fourier transform is great for finding periodic signals: you take an FFT and a periodic signal looks like a peak in the output. Well, in an ideal world, that is; you only really get such a neat and tidy peak if the periodic signal is exactly at a Fourier frequency, which happens when it makes exactly an integral number of turns over the course of the data set. If the signal is somewhere between two Fourier frequencies, the power is spread over several Fourier output values. While it's possible to interpolate a very accurate value based on the ~32 nearest values, this can be expensive, and there's a shortcut called "interbinning"; it doesn't reconstruct the phase, but you just take a scaled average of the two neighbouring bins and get a decent approximation to the value at the midpoint between two independent Fourier frequencies.
My problem, for this post, is that the theory is all nicely worked out when going from the time domain to the frequency domain, but I want to do something analogous while going from the frequency domain back to the time domain, if that's possible. (I haven't done a literature search, or even looked very carefully at the frequency-domain interbinning papers; I thought this would be a good exercise for me.)
Full post
Labels:
data analysis,
note to self,
pulsar,
pulsar survey,
python
bash pipes
I've been using UNIX for a very long time, and bash has been my shell for almost all that time, but for the life of me I can never remember how to pipe standard error anywhere. I think my problem is I've never found any logic by which the syntax makes sense. Anyway, it's:
But if you want to send the standard error and output to a file, it's the other way around:
command 2>&1 | less
But if you want to send the standard error and output to a file, it's the other way around:
command > file 2>&1
Full post
Labels:
note to self,
unix
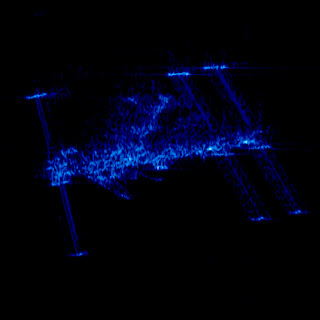
ISS in the X-band
Pretty Picture: ISS in the X-band - The Planetary Society Blog | The Planetary Society
This spooky-looking image is the international space station as taken by a radar satellite, the German TerraSAR-X.
I actually worked with these radar satellites, though they are now my natural enemies. The basic way they work is very clever, and with appropriate analysis, you can extract things like tiny movements of glaciers from the data.
Full post
Labels:
data analysis,
radar
Glitches and flares
Recently on the arxiv: Searching for X-ray Variability in the Glitching Anomalous X-ray Pulsar 1E 1841-045 in Kes 73, by Zhu and Kaspi.
Pulsars normally spin down very regularly — like clockwork, as the saying goes, and many pulsars spin down as regularly as a good atomic clock. But some pulsars, once in a while, will suddenly start spinning more quickly. This sudden (instantaneous as far as we can measure) spin-up is called a "glitch", and its full explanation remains mysterious. Generally, all we see is that the pulsar is suddenly spinning faster: no heating of the crust, no sudden X-ray emission, no radiative changes at all, just a suddenly-faster pulsar.
Anomalous X-ray pulsars (AXPs) are one kind of "magnetar", pulsars whose magnetic field is so enormous that its decay powers the X-ray emission of the star. They exhibit many peculiar behaviours, and are a major field of study in pulsar research. AXPs will occasionally become much more active for a while: they become much brighter, they emit random blasts of X-rays, and they do other peculiar things. It seems as if they may glitch every time they become active like this. If we want to find some sort of relationship between glitches and these active periods, it would be valuable to know whether an active period happens every time AXPs glitch, or whether AXPs sometimes have "quiet" glitches, like normal pulsars. That's what this paper tries to answer.
Full post
Killer radiation
I've been working in the undergraduate labs lately, checking the setups for the undergraduate laboratory project course. The course has any number of interesting projects, like spatial filtering of images using Fourier optics, measurements of the Hall effect, demonstrations of Rutherford scattering (after all, he had his laboratory in the building that is, now that it has been decontaminated, our library), and so on. The setup for the experiment on Compton scattering, pictured to the right, has all sorts of terrifying warning signs all over it, because it necessarily uses a powerful gamma emitter. Just how dangerous is it?
This is not purely a theoretical question, since the head lab technician caught a student looking down the beam at the unshielded source, prompting the numerous warning signs. So just how much harm did that student do themselves?
The source is about 100 millicuries of cesium 137, and emits 661.6 keV gamma radiation. In SI units, that's four billion becquerels (decays per second). But what does this translate to in terms of exposure (measured in sieverts)? This is a more complicated calculation, since the kind of radiation matters, as well as the geometry and time of the exposure.
For the purposes here, though, I'll just point to a list of gamma ray dose constants, which give the exposure rate in rem/hour for a one curie source at a distance of one meter, and note that in these units cesium-137 has a dose constant of about 0.4. So a hundred millicurie source produces roughly 0.04 rem/hour, or 0.4 millisievert per hour.
At this rate, if you stood there and stared into the source for two and a half hours, you'd get Health Canada's recommended yearly radiation limit for the general public. It'd take a hundred and fifty hours to get the limit recommended for people who work with radiation. At two hundred and fifty hours (if that still counts as "acute") you might raise your cancer risk by 0.8%.
All this is to say that while I don't think it's a good idea to look into the source, and certainly not to touch it, and I wouldn't want to work with it every day, the warning signs are perhaps a bit over-emphatic.
Full post
Labels:
physics
Honey oatmeal bread
I think this is my favourite bread machine recipe so far; light and fluffy, a little sweet, and very tasty.
Full post
Labels:
note to self,
recipe
Flops and the FFT
The Fast Fourier Transform is a wonderful family of algorithms that have made whole fields of study possible. They mostly operate by breaking a large problem into some number of equally-sized smaller problems, all the way down to problems of just a few points. As a result, the prime factorization of the number of points can make a large difference in the speed of the calculation. Traditionally, powers of two have been the fastest (or the only) sizes available, so the wisdom has been that if you have a data set whose length is not a power of two, you should pad it to the next larger power of two. It turns out that, at least in some cases, that is a mistake.
For context, I am still thinking about the problem of coherent harmonic summing in pulsar searches. As I worked out before, it's important to have an accurately-interpolated Fourier spectrum, and it turns out that the simplest way to do this is to simply pad the input array before taking its Fourier transform.
For a two-minute observation, we are taking about twelve thousand power measurements per second (yes, this is basically an audio data rate; but it only appears once we have combined all 4096 frequency channels), so the raw data is about 1.48 million data points (the exact length of our observations varies slightly). We need to pad this to eight times its length to get good enough sampling in the frequency domain, so that's about 11.8 million data points. The question is how much more to pad this in order to make the FFT fast.
I'm using FFTW for the Fourier transform, and it has efficient algorithms for powers 2a3b5c7d. So while I could pad my FFTs to the next power of two (about 16.8 million), I could also pad them to 12 million exactly, or to the smaller value of 11854080, which still factors nicely (28335173). I know that those powers of five and seven are not as efficient as those powers of two, but on the other hand, flops are cheap, while increasing the data size by almost a factor of two potentially means an awful lot more memory access (obviously these giant FFTs aren't going to fit in cache, though FFTW is smart enough to arrange the pieces for the best possible cache coherence). So I thought I'd do a comparison.
The results are:
- 16.8 million points: 1.7 s
- 12 million points: 0.8 s
- 11854080 points: 1.0 s
Full post
Moon rot!
Recently on the arxiv: Long-term degradation of optical devices on the moon, Murphy et al. This paper talks about the retroreflectors left on the Moon by the Apollo and Lunokhod missions, and observes that they have dropped in effectiveness by a factor of ten since they were placed. So far from the moon being a hostile but static place, something has been steadily degrading these mirrors.
Among the things the Moon missions left behind were arrays of retroreflectors. Like street signs, bicycle reflectors, or those weird-looking radar octahedra, these take incoming light and beam it back to where it came from. These are useful scientific tools, because you can fire lasers at them and time how long it takes the pulses to come back, in the process measuring the Earth-Moon distance. The current best setup, APOLLO, measures the distance to the nearest millimeter, which lets us test theories of gravity, detect a liquid core to the Moon, and watch the Moon recede from us (well, at 38 mm/year).
The moon is very far away (unlike the International Space Station, which orbits at an altitude of only a hundred kilometers). So when you beam a laser at it, even if you use a telescope to collimate the beam, it's spread over 7 km when it reaches the Moon. Then any imperfection of the retroreflector, or simple diffraction, spreads the return beam over an even larger area (20 km); your telescope picks up as much of the returned light as it can, but APOLLO sends out pulses of 1017 photons and gets back only about one photon per pulse. These tremendous losses are a challenge, so the authors of this paper (who work on APOLLO) monitor the efficiency of the system.
What they noticed, spurring this paper, was that the efficiency dropped substantially — by a factor of fifteen — near the full Moon. Now, obviously the full Moon is very bright, so background photons make detection more challenging, but it is easy to measure the background and estimate how much harder it makes detection; this effect is far from enough to explain the dip. By itself, a dip at full Moon isn't that exciting; since the Apollo 15 retroreflector is pointed at the Earth, a full Moon is when the Sun is illuminating it nearly face-on, so thermal effects might explain it (and in fact since it works by total internal reflection, it only serves as a reflector out to about 17° from the vertical, while the dip is about that wide, at 30°; the authors don't mention this, so it may be coincidence).
To investigate this dip in efficiency, though, the authors of the paper went back and looked at older observations. In the initial years, lunar laser ranging was done with the 2.7m Macdonald Observatory Smith Telescope. But rather than compete for time on this large telescope, in 1985, the program switched to using smaller, dedicated telescopes. Unfortunately these smaller telescopes couldn't see the reflections near full Moon, so there's no data from 1985 to 2006, when APOLLO went online. But comparing the APOLLO data to the MST data, they find that the dip at full Moon was not present at first, and gradually grew as time went on. What's more, if they looked at the return rate away from full Moon, they found a uniform decay; right now the retroreflectors are returning about a tenth what they did initially.
So what's happening to the retroreflectors? How are they getting worse? It's obviously not rain or wind, the moon being devoid of either, let alone the kinds of organic decay you see here on Earth. As with almost all real science, the authors cannot offer a definitive answer, but they do discuss some possibilities.
First of all it's worth pointing out that the huge drop in efficiency doesn't mean the reflectors are absorbing all that extra energy; they are almost certainly reflecting it but in the wrong direction. They're cube corner reflectors, and if you distort the shape of a cube corner reflector it doesn't reflect light back in quite the same direction it came in. The authors find it would take about 4°C temperature difference across each cube to produce the full-Moon losses they see. So if for some reason the reflectors are now absorbing a small fraction of the blazing unfiltered sun at full Moon and being heated by it, that could explain the dip in effectiveness. But why are these mirrors absorbing more and more of the sunlight?
The authors' most plausible answer, to my eye, is dust. The surface of the Moon is covered with dust, made by thermal weathering of rocks and by micrometeorite impact. This dust does not of course blow around the way terrestrial dust does, and in a vacuum a tiny dust grain should fall as fast as a rock, so it initially seems difficult to explain how much dust could get on top of the reflector. There are micrometeorites, though, and there is an effect I hadn't heard of before: dust particles become electrostatically charged through irradiation and are either levitated or thrown upward in "fountains" by electrostatic repulsion. We think. What we do know is that observations from the lunar surface show the optical effect of dust above the ground. So however this dust gets up there, some of it can plausibly fall on optical equipment left there by astronauts.
A layer of dust on the surface would also naturally explain the general decay in effectiveness even when not being heated by the Sun. So it looks like perhaps things left exposed on the lunar surface get covered with dust fairly rapidly. This I find interesting in its own right, but there are also various plans to build telescopes on the lunar surface, since these would share the advantage of the Hubble space telescope of images undistorted by atmosphere, while being able to rely on gravity to hold things in place, and possibly even being able to be built out of lunar materials. If they rapidly become coated with dust, those plans will have to come up with some scheme for cleaning the optical elements.
Full post
Multigrain bread
My second attempt at a multigrain bread in my newly-borrowed bread machine.
Ingredients:
Incidentally I need to get more containers for all this flour. It used to be something I bought the smallest possible bags of because I never finished it, but with this bread machine I go through a lot.
(That odd-looking lump on the loaf above is a piece of dough that didn't get properly mixed in. This happens from time to time with this bread machine; it actually pauses during the mixing and beeps at you to give you a chance to push any such lumps back into the mix, but I wasn't paying attention to this loaf. Most loaves don't need this extra attention.)
Ingredients:
- 250 mL water
- 15 mL olive oil
- 15 mL sunflower seeds
- 15 mL flax seeds
- 15 mL pumpkin seeds
- 15 mL quinoa
- 15 mL millet
- 5 mL salt
- 325 mL bread flour
- 250 mL whole wheat flour
- 30 mL honey
- 10 mL yeast
Incidentally I need to get more containers for all this flour. It used to be something I bought the smallest possible bags of because I never finished it, but with this bread machine I go through a lot.
(That odd-looking lump on the loaf above is a piece of dough that didn't get properly mixed in. This happens from time to time with this bread machine; it actually pauses during the mixing and beeps at you to give you a chance to push any such lumps back into the mix, but I wasn't paying attention to this loaf. Most loaves don't need this extra attention.)
Full post
Labels:
note to self,
recipe
Bread machine
I'm not a great cook; I usually don't have the energy to cook anything interesting, so I tend to fall back to the very simple. (Plus Montreal has zillions of great restaurants, so it doesn't take much excuse to make me go out to eat.) But fresh bread is delicious, so when I visited my parents and they had a bread machine scavenged from the kerb, I was happy to give it a try. I was impressed, but felt like I would probably use it for a little while and then it would sit cluttering up my kitchen. So when some friends mentioned that they had a bread machine they weren't using, I asked if I could borrow it.
I figure, they used it a lot for a month, then got bored of the bread and put it in storage. If I use it for a month and then get bored, well, maybe they'll find someone else to lend it to afterwards. And maybe after a while they'll have a craving for bread again; seems like a fine solution. (Of course, bakeries are a perfectly fine solution too, and indeed I do like to buy a nice Première Moisson baguette from time to time.)
What sold me on a bread machine was not the fine bread it could make — though I did have some nice loaves — but how easy it was to make bread. Now I can have put off going to the grocery store for far too long, so there's no longer anything perishable in the house, but toss five ingredients in the machine, hit a button, and lo and behold, fresh bread:
There's even a "French" bread recipe that works if I'm out of oil:
The biggest problem with the machine is that it takes three hours to make the bread, and about half an hour before the bread is ready it starts smelling delicious.
I figure, they used it a lot for a month, then got bored of the bread and put it in storage. If I use it for a month and then get bored, well, maybe they'll find someone else to lend it to afterwards. And maybe after a while they'll have a craving for bread again; seems like a fine solution. (Of course, bakeries are a perfectly fine solution too, and indeed I do like to buy a nice Première Moisson baguette from time to time.)
What sold me on a bread machine was not the fine bread it could make — though I did have some nice loaves — but how easy it was to make bread. Now I can have put off going to the grocery store for far too long, so there's no longer anything perishable in the house, but toss five ingredients in the machine, hit a button, and lo and behold, fresh bread:
- 250 mL water
- 60 mL olive oil
- 15 mL sugar
- 5 mL salt
- 750 mL flour
- 8 mL yeast
There's even a "French" bread recipe that works if I'm out of oil:
- 250 mL water
- 60 mL sugar
- 8 mL salt
- 750 mL flour
- 8 mL yeast
The biggest problem with the machine is that it takes three hours to make the bread, and about half an hour before the bread is ready it starts smelling delicious.
Full post
Labels:
note to self,
recipe
Blind Zen programming
A recent alarming network problem while trying to observe remotely at Green Bank brought back memories of the age of the 2400 baud modem, when you could often type faster than the system could display your characters. Fortunately I use the text editor vi, which was designed for these conditions. In fact, in this light some of the user interface decisions make a lot more sense.
The most prominent weird UI decision is that the editor has two "modes": insert mode, in which you can actually type text and it goes into your document, and "beep mode" in which the letters on the keyboard all tell the editor to do something (and it beeps if that something doesn't make sense). For example, to move around your document, the keys hjkl move you left down up and right, respectively. Bizarre as it may seem, these keys are on the home row, so if you're doing a great deal of moving around — particularly common when programming, i.e., debugging — this makes a certain sense. (Plus vi users get so hardwired that these become perfectly rational movement keys in video games.) The decision to have an editor-control mode also means that you don't need to press the "control", "alt", or "meta" keys very often, which makes sense since these often didn't work or were inconsistently placed on old UNIX machines. (I spent a while switching between terminals, some of which had "Caps Lock" and "Control" interchanged, and to this day I disable "Caps Lock" on every keyboard I use.)
The use of ordinary (case-sensitive) letter keys for editor commands also means that there's room for lots of editor commands, and they're very quick to use. So, for example, to search forward, you use "/"; "n" takes you to the next match and "N" to the previous. But there's also "f", which searches forward for a single character. While apparently bizarre, when combined with the ability of commands like "delete text" (d) to take an argument, this means you can do "delete up to the next single-quote" with "df'".
All this makes even more sense when it might be seconds from when you type a key to when you see its effect. So if, for example, you're typing along and you realize "hey wait, that 'a' was supposed to be an 'i'", instead of pressing the cursor keys many times and waiting to see where the cursor wound up, you can compose sequences like "Fari$", which will search back to the a, replace it with an i, and return you to the end of the current line. It's a bit like being the blind Zen archer.
All that said, I must make a peace offering to those in the emacs camp: being written not so much later, it offers similarly complex editing functionality, with similarly unusual (but different) UI decisions. I used emacs for years, switched to vi for some reason or other, and have stuck with it through inertia, mostly. (Even in the ubiquitous text boxes on the web I find myself hitting Escape followed by strings of gibberish. I'm not quite hardcore enough to go figure out how to make Firefox use vi as its editing component.)
Full post
Labels:
computers,
observing,
retrocomputing
RFI
I'm currently involved in another low-frequency pulsar survey with the GBT. This is a pointed survey, so we take two-minute pointings in an array tiling the whole northern part of the sky. This is an incredibly sensitive setup, so we will hopefully find a nice collection of new pulsars. Unfortunately, the same arrangement that makes us sensitive to pulsars makes us sensitive to lightning, electric motors, the local power lines, passing aircraft... all sorts of signals, generally outside our intended piece of sky and/or outside our intended frequency range, but also generally vastly more powerful than the pulsars we're looking for. So dealing with this junk — generically called RFI (Radio Frequency Interference) — is an important part of our survey strategy. My topic today is not so much dealing with the mild RFI we see all the time as dealing with what we see every now and then: a tremendous signal comes booming in, overwhelming everything and ruining the data (as seen on the right).
First of all a brief summary of how our system works: The telescope has a receiver at the primary focus, basically a pair of crossed dipoles. This converts the electromagnetic waves to signals in the wires, where they're amplified, encoded in analog on light and sent down an optical fiber to the control room, where it's converted down to a standard frequency range. This is fed to GUPPI, a so-called "pulsar backend". This instrument does analog-to-digital conversion on the signal then uses a polyphase filterbank to efficiently split it into 4096 channels, then computes the power in each channel; this power is averaged over 81.92 microseconds, after which the set of 4096 powers is dumped to disk.
Pulsars are broadband signals, so we use the widest bandwidth our receiver can handle, about 80 MHz centered near 350 MHz. This gives us the best signal-to-noise from our pulsars, but it also means we can't stick to the few narrow bands reserved for radio astronomy. In fact, the region we're using is allocated for various kinds of radio operation, including "aeronautical radionavigation" around 330 MHz. The GBT is in the National Radio Quiet Zone, so with luck much of this spectrum might be clear, but if aircraft are really using it to navigate there's no keeping them out of our airspace. (And at least once when I've complained of RFI the GBT operator has noticed an airplane passing to the north, for what that's worth.) In any case, there is interference to deal with.
Old radioastronomy systems, in order to get the widest possible bandwidth, quantized the input signal to one bit, or three levels, on initial digitization. This has the serious drawback that any small change in the signal levels causes the digitizer to overload or underflow, trashing the output. Newer backends improve on this by using 8-bit digitization, so that you have more than twenty decibels difference between underflow and overflow; it also helps that they are sampling a wider bandwidth, so that it takes more power to substantially change the levels. So generally, when a noise signal is picked up by GUPPI, it is narrowband and produces excess power in one channel. But the polyphase filterbank is good at keeping it from spilling into neigbouring channels (much better than a simple FFT) as long as it doesn't overflow the system, so usually you see something like this:
This shows, in red, the average power in each channel, and in blue, the standard deviation in each channel; since what we are receiving is basically noise, the standard deviation in each channel is large. The overall profile is the sensitivity of our system as a function of frequency. You can see it's not flat over the 80 MHz we want and zero elsewhere, but some complicated bumpy shape; that's the joy of analog components. In fact, given that it's an 80 MHz band at only 350 MHz, we're doing well to have a filter even that good. The point of this plot, though, is those vertical lines. Those are channels where some narrowband signal is coming in, so strongly that it stands way out above the noise. But it's okay; we have four thousand channels, we can afford to throw away a handful, and we have tools to detect when to throw them away (clever tools that look not just for strong signals but also for weaker signals that are narrowband and periodic, since those are a real headache for pulsar searching). So this plot is of one of our good beams.
The beams I'm worried about are the ones that look like this:
Here what's happened is we have some narrowband signal that is so monstrous it's overloading our digitizer. The digitizer's saturation is a nonlinear effect, so it doesn't stay politely in one channel; instead it splatters all over the place, producing both ugly broad peaks as on the right, and (I think) the regularly-spaced vertical lines (though they might be something else). When this happens there's not much use to be had from the data; while it's possible we might detect a pulsar through all that muck, on the one hand we'd be vastly less sensitive, while on the other if the interference has any periodic component to it, it'll produce zillions of false-positive periodicity candidates to wade through. So we need to discard beams like this one.
Fortunately, since we're doing a pointed survey, if we find that a beam has been trashed by RFI, we don't have to just write it off and leave a gap in our survey coverage: we can just put the beam back on our to-observe list. No problem. All I need to do is come up with a scheme for detecting these bad beams automatically, since we often run our survey observations semi-unattended (once they're up and running, I often give the operator my cell phone number and ask them to call me if something like a wind stow or a snow dump comes up; one of my colleagues will often do this and then go to sleep).
Initially, we were planning to run the RFI detection and excision scripts as part of our survey processing. Unfortunately, pulsar survey processing is incredibly CPU-intensive - we are just now finishing off the processing for the drift-scan survey, whose datataking finished in mid-2007. Clearly if we wait until the beams are processed to decide which are RFI-laden, the survey will long be over before we find out which beams we should have reobserved. Fortunately, the RFI detection code isn't too compute-intensive; an eight-processor modern machine running jobs on all processors ought to be able to process eight two-minute beams in about fifteen minutes.
The RFI detection code isn't perfect, though: I found that it was able to detect overloaded channels, but a few overloaded channels are normal. When too many are overloaded we can discard the beam, but I found that there were beams where not very many channels were actually overloaded, but those few splattered into neighboring channels. So my prototype system does an additional test: it compares the bandpass of each beam with the instrument's normal bandpass. This sort of works, but it revealed some surprising things:
This is a different plot of the same sort of thing. The red curve is the bandpass of the system, estimated by taking the median of all the day's beams. The green curve is one of the horrible contaminated beams. But the blue curve is from a beam that is probably fine. But its bandpass looks decidedly different (enough so to trick an early generation of my script into marking it bad). It turns out that what has happened is that this is a beam shortly after a contaminated beam. While the RFI was going on, we ran a system "balance", which adjusts the gain/attenuation at many points along the signal path so that in each stage it's at a comfortable level. Since there was powerful RFI, the gains and attenuations all got readjusted, and all differently. Since different parts of the signal chain affect the bandpass differently, we got a different bandpass. (We also got a drastically reduced signal amplitude, but fortunately GUPPI gives us plenty of dynamic range, as I mentioned above.) So I have to be a little careful when comparing bandpasses so as not to reject minor changes like this. Fortunately the "splatter" from bad RFI is pretty obvious in the statistics, so now I think I have a working bad beams detector. I'm just waiting for feedback from my collaborators before putting it into service.
Some comments on the tools I used to build it: I wrote the code in python and numpy, of course. But key to the process was a module by the author of the RFI detection tool that let me construct python objects from the detector's statistics files. Given this, I used medians to construct a bandpass for each file (since medians are better than means at discarding crazy outliers, which is the whole point of the exercise). I then used masked arrays to flag any bad channels, and scale the result so its median is one. I repeat this process on many beams, then take a median (using the masked array median to nicely ignore any bogus data points). This gives me my system bandpass. Comparing an individual beam to the bandpass then proceeds by constructing a masked median of the file as before, scaling it so its median matches that of the system bandpass, and then counting the points where it is very different.
In all, it has proved invaluable to have the masked array tools; they just do the Right Thing with bad data, vastly simplifying my code.
Full post
Labels:
astronomy,
data analysis,
pulsar,
pulsar survey,
python
Artificial gravity round 2
This alarming gadget, a Lava Lamp Centrifuge demonstrates some of the problems I discussed in my post on artificial gravity:
(via How to Spot a Psychopath)
As the builder puts it:
He doesn't mention that lava lamps are full of liquid that is hot and flammable and in close proximity to electricity.
He also discusses how he supplies power to the lava lamp: he wired up a quarter-inch phone jack to 120 V AC, noting that the connector can be rotated freely while still making a connection (until the contacts wear out, presumably, not being designed for any of constant rotation, 120 V, or any appreciable power). He avoided other connections by using a battery-powered accelerometer and video camera.
(via How to Spot a Psychopath)
As the builder puts it:
The centrifuge is a genuinely terrifying device. The lights dim when it is switched on. A strong wind is produced as the centrifuge induces a cyclone in the room. The smell of boiling insulation emanates from the overloaded 25 amp cables. If not perfectly adjusted and lubricated, it will shred the teeth off solid brass gears in under a second. Runs were conducted from the relative safety of the next room while peeking through a crack in the door.
He doesn't mention that lava lamps are full of liquid that is hot and flammable and in close proximity to electricity.
He also discusses how he supplies power to the lava lamp: he wired up a quarter-inch phone jack to 120 V AC, noting that the connector can be rotated freely while still making a connection (until the contacts wear out, presumably, not being designed for any of constant rotation, 120 V, or any appreciable power). He avoided other connections by using a battery-powered accelerometer and video camera.
Full post
Gallium
Through the magic of ebay, I bought some gallium. It's strange stuff. Apparently whether it's listed as liquid or solid on periodic tables depends on where the table is printed; the melting point is 30°C, so it's solid at room temperature if the room's in Canada in March. But it'll melt in your hand, though it's a slow process.
Gallium is a crystalline solid; I suppose many metals are, but the crystals are really obvious when gallium solidifies. I thought I'd take a video of gallium crystallizing, but it has a tendency to supercool, so after sitting at room temperature for hours it was still liquid. I dropped a crystal of gallium in, though, and I got this beautiful slow crystal formation:
This video is shown at twelve frames per second, each frame is 60 seconds of real time. (It starts when it does because that's when I realized nothing was going to happen immediately; it ends when it does because that's when my camera overheated (!).)
Those vague angular patterns on the surface are actually crystals forming underneath. When I tipped the dish so the liquid flowed away I saw this:
Unfortunately, gallium is directly below aluminum on the periodic table, so, like aluminum, it reacts very rapidly with air, forming a sticky surface scum. When gallium is liquid, though, this scum can't stay in place to protect the surface; instead it sticks to everything around it. Rolling gallium through your fingers feels very peculiar — it's decidedly denser than water, though not tangibly more viscous, and it doesn't feel cool (its vapor pressure at room temperature is tiny). But because of the oxidation, it leaves a gray scum all over your hands. Pieces of gallium left in air also quickly start looking dull and dirty.
Full post
Labels:
do it yourself,
photos
Cyberpunk gadgets
Maybe this dates me, but I remember when cyberpunk was the hot new kind of science fiction. It replaced the utopian or social-experiment future societies with one in which the cancers of our own grew unchecked - corporate rule, environmental devastation, and urban decay were the future. The characters and stories tended to be gritty and ambiguous, computer hackers, drug pushers, or hit men (or pizza delivery boys, yes). My big complaint was that somehow in every story the hero has to Save The World from some quasi-magical and universal threat, be it AI, computer viruses that afflict humans, what have you. My point today, though, is about all those high-tech cybernetic implants the characters always have.
I mean, okay, who wouldn't want to be smarter, or stronger, or to remember everything on the Internet, or to be able to sense magnetic fields? Well, okay, maybe not everyone; in fact I'm just as happy having most of that with gadgets I can carry around and replace when they break. (Particularly if, as in most cyberpunk stories, upgrades and repairs happen in filthy little underground clinics.) But let's leave that aside; what I've been thinking about is whether such gadgets make sense at all.
First of all, implanting anything in the human body is a tricky business, but we can do it. Hip replacements are amazingly successful; their biggest problem is that since the replacement hip is not repaired by the body, it can wear out. Since you need to remove a few centimeters of thighbone to take it out, you can't do this very many times. What about more complicated implants? Well, the immune system can be a problem, since it tries hard to destroy anything that seems alien (even, unfortunately, sometimes parts of the body; often this is the reason hips need to be replaced). The immune system uses powerful peroxides and chlorine radicals to destroy things, so even quite chemically-resistant materials can break down eventually. The lady who implanted a magnet in a finger so she could sense magnetic fields found that after a few years, the magnet had been broken up and reduced to powder. But as artificial hips and pacemakers show, these issues can be managed, with care. So it is possible to put things in the body and have them last.
One thing that is a big problem, though, is the skin. The skin is a very carefully-maintained barrier against the environment. All the usual routes into the body are very carefully guarded by systems ranging from a continually-replenished layer of mucus in the nose to our tendency to flinch away from anything getting in our eyes. Any new opening in the skin, say a small cut or scratch, must be carefully kept clean until it heals, and even so mild infection is common. The body's response to infection is to send swarms of immune cells to destroy anything even vaguely suspicious in the area. So if you want to have some sort of implant with a plug or tube connection to the outside, you're going to have to devise some way to prevent infection at that hole in the skin. People do have this sort of implant — chest tubes, catheters, and so on — and infection is a constant problem. Fighting it is made particularly difficult because bacteria form biofilms adhering to the surfaces of foreign objects, so that even if a treatment kills all the surface bacteria, it must still penetrate them to reach the bacteria underneath. So if at all possible an implant should avoid piercing the skin.
Is this possible, for the kind of electronic gadgets that cyberpunks get installed? I think so, more or less. There's no need to have an electronic connection to transmit data, as Bluetooth headsets demonstrate. Power is a more difficult problem; electronic gadgets do draw power, sometimes quite a few watts. A sufficiently advanced technology would let the surgeon hook up a little artery and vein, and then run off the sugar and oxygen dissolved in the blood. But chemical interactions with the bloodstream on the scale needed to power an electronic gadget open up a massive can of worms — what kinds of other chemicals will be unintentionally exchanged into or out of the bloodstream? How can you exchange chemicals with the bloodstream without exposing yourself to immune system attack? How do you maintain vascularization without risking clotting? Bluetooth headsets and the like currently use batteries, but for an implant you have to worry about how they're recharged (unless maybe you use plutonium). My suggestion is to use magnetic induction — like cordless electric toothbrushes, you put a coil in the implant and a matching coil on the charger, so that when you bring them close they form a transformer and you can feed power in. This has its own alarming failure modes (overheating, overloading, stimulation by unintended machinery, interaction with magnets), but it will work.
The next question, of course, is what do you actually need an implant for? Frankly, most of the things cyberpunks use them for are now available for the iPhone. Or, if you like, the oddly creepy wearable computing gadgets. (For that matter there's even a non-implanted version of the magnetic field sensor.) Exceptions I can think of are gadgets that interact with the bloodstream or the nervous system directly. The nervous system I can sort of see being useful, but it's incredibly complicated, doesn't heal much, and messing with it is extremely invasive. So that's pretty daunting. Dealing with the bloodstream is more reasonable; there are already partially-implanted gadgets for diabetics to try to manage blood sugar. While this sounds like a great idea, cimpletely implanted gadgets would have a finite reservoir of insulin to work with, so they would need to be replaced or refilled regularly. Unless we figure out how to build a gadget that can make insulin from blood components, that problem's not going away. Genetic engineering offers possibilities - I can imagine a little gizmo that contains a few of the patient's own cells that can be zapped to persuade them to produce insulin on demand. Immune system issues are going to be something of a challenge, particularly if it turns out that a patient's diabetes was caused by their immune system attacking their insulin-producing cells in the first place. On the other hand, if you can clone and grow cells that produce insulin, why not let the body's natural regulation run things without the need for any implant beyond the cells themselves?
In summary, I think that implanted hardware will always be very costly, not just in economic terms but in terms of the user's health and in terms of maintenance. Given that, there would have to be a very strong need for them that couldn't be met using other, safer and cheaper tools. Shame that, I always liked Molly's scalpel claws.
Full post
Cyclotron! Isotope! Logarithme!
One of the French Wikipedia's more amusing pages: Vocabulaire du capitaine Haddock. (Sadly, it is no longer named "list of Captain Haddock's insults".)
For those of you suffering from cultural deprivation, Captain Haddock is a friend of the young reporter Tintin. He is an old sea captain, and is therefore often drunk and forever cursing. Rather than the more usual grawlixes, Captain Haddock's cursing is inventive and often bizarre, calling people things like "bashi-bazouk", "macaque", or the three in the title of this post. (I don't know what the English translations are like, but I assume they kept the colour and variety of the insults. My school library only had the books in French.)
Wikipedia being Wikipedia and Tintin being extremely popular among French speakers, a list of all these diverse insults was created in 2004 and has now ballooned into a categorized, fully referenced list of links to dictionary meanings and articles. Isn't the Internet great?
Full post
Edible astronomy
I realize I am again dating myself, but back in the day I used to read a number of usenet groups; alt.folklore.urban was a particular favourite, and I still retain some quirks of textual style I picked up there. One newsgroup I always kept an eye on was alt.humor.best-of-usenet. I didn't, by design, have any original content; instead any particularly amusing post from any other newsgroup could be forwarded there. They weren't always funny, but some postings were downright hilarious. Recently I came across somebody's archive of their favourite postings, a number of which I remember. One I didn't see at the time I find hilarious: What if the moon were made of green cheese?
The science seems about right.
Full post
Labels:
funny
Thresholds
I apologize for three highly-technical posts in a row; I'm trying to work something out and setting it down "on paper" as it were is helping. I promise I'll come up with a post about kittens or something soon.
Suppose you're searching for pulsars. You're going through the Fourier transform looking for peaks. Now suppose you've found one: how strong is it? Is it statistically significant? For that matter, is it better than any of the list of peaks you're already keeping track of?
To answer this question you need two pieces of information: how strong the background noise is, and how likely that noise would have just randomly produced a peak this high. There's some cleverness in estimating the background, since real signals don't have perfectly flat white noise backgrounds, but I'm going to leave that aside for the moment. My question for today is, what are the statistics of a coherent peak-based search?
I think they can reasonably be estimated by ignoring any oversampling and assuming that, in the absence of a signal, if you're using n harmonics, the profile consists of 2n independent Gaussians with standard deviation 1. So the question is, for a fixed false positive probability p, what threshold should we set? The answer is roughly the threshold for a single Gaussian to exceed p/2n.
This is a little inconvenient to work with, since it requires the error function and its inverse (or an approximation), but flops are free. I suppose calling the error function code might cause cache misses, but I don't imagine needing it that often. Specifically, my idea is this: a simple implementation might just set a threshold at the beginning and run through the whole FFT. But if the observation underwent bad enough RFI, you could find yourself with millions of candidate signals. Since you'd be fine-tuning and storing every one, this could slow things down a lot. My idea is instead to specify a maximum number of candidates - generously, maybe a few hundred - and keep the best ones. This means raising the threshold every time you get a new candidate once the list is full. This wouldn't require the error function except that you don't only want to look at candidates with the full 64 harmonics - you also need to consider those with fewer. And converting thresholds between different numbers of harmonics does require the error function.
Full post
Coherent harmonic summing
As I alluded to in a previous post, you can (and it is sometimes useful to) take a giant FFT of a time series, extract a series of harmonically-related coefficients, and with an inverse FFT, produce a "pulse profile" showing the data "folded" at the period of the fundamental. This is interesting in part because you can use the peak height to gauge the strength of the signal, taking advantage of the relative phases of the harmonics. My question today is, when you're extracting those coefficients, how accurate do you need to be?
If all you want is the power, then a first approximation would be to simply choose the nearest Fourier frequency. This, after all, is where your FFT naturally measures the coefficient. I'll call these "independent Fourier frequencies", and the spacing between them the "independent Fourier spacing" (IFS). It turns out that if you have a frequency exactly halfway between two independent Fourier frequencies, you lose a substantial amount of sensitivity: a nearly 36% loss of signal-to-noise. You can cut this back to something like 7.4% using an ultra-simple interpolation scheme called "interbinning".
What about coherent reconstruction? Well, now we need not just the amplitude but the phase. The amplitude is relatively easy to get close to since it's at a maximum at the point of interest, so that the first derivative is zero and you have little dependence on the frequency. The phase does not have an extremum at the correct frequency, so it may well be varying rapidly. In fact, for a signal that is present uniformly throughout the observation, the phase changes by pi units per IFS. So if we use a spacing of IFS/2, which would have been adequate for the power, our phase will be wrong by as much as forty-five degrees.
What we care about, though, is not the phase exactly, but the real part. More, there are really two questions here: how well do we need to interpolate the FFT to get reasonably accurate Fourier coefficients, and how closely must we space our inverse FFTs?
First the easy question: how well do we need to interpolate to get decent Fourier coefficients. There are techniques for doing really good-quality interpolation in FFTs - you can use sinc interpolation (based on the 32 nearest samples), or you can just pad the time series before taking your giant FFT. But this is somewhat expensive. Since flops are free as long as they only access memory you've recently read anyway, to speed things up you can always linearly interpolate between more-carefully interpolated samples. So here's a plot of the error introduced by that linear interpolation:
So if you do proper Fourier interpolation to a spacing of IFS/8, and linear interpolation beyond that, then your measured amplitude will be off by less than about 3%. Using IFS/4 still leaves the worst-case error at about 7%, about the same as interbinning.
Now for the tougher question: how far off can our estimate of the frequency be when we reconstruct our profile? This is crucial, since it determines how many inverse FFTs we need to do, and these are probably the most expensive part of the calculation. We can safely think of this in the time domain: we have a narrowly-peaked pulsar, and we're folding the incoming data at a slightly wrong frequency. How much does this lower the peak amplitude?
Well, if the frequency is wrong, over the course of the observation the pulsar's peak will drift in phase. The average profile will then be smeared out by the amount of drift. Exactly how much it will lose in peak height depends on the pulse shape. An error in frequency of one IFS will result in one full cycle of drift (in fact this is what defines an IFS). So if we are going up to the nth harmonic, then an error in (fundamental) frequency of IFS/n results in one full turn of drift for that harmonic, and we might as well not have bothered with that harmonic. But focusing on an individual harmonic can answer the question.
The loss in amplitude of a harmonic whose frequency is off by x is given by the sinc function; if we approximate the sinc function with its quadratic Taylor polynomial, we get a loss equal to x2π2/6, where x is the frequency error in IFS. Now, if we suppose that the profile is effectively a delta function, so that its n coefficients are all 1/n, then the total error is the sum over m of m2x2π2/6n or x2n(n+1)(2n+1)π2/36n.
What this works out to, once you clear up the messy math, is that if you sample the top harmonic at IFS/2, you lose about 14%; if you sample at IFS/4 you lose about 3.6%, and if the odd number doesn't make you queasy and you sample at IFS/3 you lose about 6.3%. (It turns out the number of harmonics is nearly irrelevant.)
So, in short, if you interpolate the FFT to IFS/8 and linearly interpolate beyond that, and you take an FFT every time you advance the top harmonic by its IFS/4. you'll lose no more than about 5% sensitivity at worst. If you cut your number of FFTs in half (which probably cuts your runtime in half), you lose at worst maybe 20% of your sensitivity, but you can probably make it up by setting a threshold 20% lower, then "tuning up" each candidate to find the best period.
Full post
Flops
In a recent astronomy talk, the speaker was discussing some sort of heavy-duty calculations, and how to make them faster. The way he put it, ultimately, was "flops are free". That is, CPUs are so fast now that they spend almost all their time waiting for data to be fetched from main memory: this means that the time it takes for a job to run is determined not by how many floating-point calculations it has to run but by how much data it must read from main memory.
This is kind of an astonishing statement, really: it says you can add floating-point calculations to your code at no extra cost. Of course such a statement can only be true for certain computing tasks on certain platforms, so I thought I'd test how true it is for a particular computing task I had in mind.
The task, you will probably not be surprised to discover, is pulsar searching. Specifically, I want to think about going through the Fourier transform of an observation looking for periodic signals.
Traditionally the way to do this is to take a giant FFT, square it to extract the power, and look for statistically-significant peaks. In fact, since pulsar signals are typically not just sine waves, one normally adds up the power from several harmonics and looks for statistically-significant peaks in the total power. There are lots of important details, but let's leave those aside for the moment. The idea I've been thinking about for a while now is based on a distinction.
When you estimate the total power in the harmonics, by a beautiful theorem in harmonic analysis, you are effectively estimating the root-mean-squared amplitude of the pulsar's folded pulse profile. But if you look at a profile that has one narrow peak, as many pulsars do, the peak-minus-mean amplitude can be much much more significant than the root-mean-squared amplitude. Back in the Fourier domain, when you have a single peak, not only is there power in many harmonics, but those harmonics line up in phase. The usual approach ignores the phases of the harmonics entirely. How much could be gained by paying attention to them?
Some informal experiments suggest that for a pulsar that is on only 1% of the time (which is not too rare among slow pulsars), this approach may offer something like a 40% improvement in sensitivity. Since that's the same as doubling the observation time, I think it's worth looking into.
As with everything, this improved sensitivity comes at a cost. In particular, all the codes we have to compute it are substantially slower than the code we have that uses the incoherent approach. So, thinking about how to speed things up, it occurred to me to look into just why the code was slow.
I'm sure there are brilliant and subtle tools to count cache misses and do nanosecond timing on running code, but I thought I'd take a more direct approach: just write dummy code that does only one thing and time it. In particular, what I want to compare is the time to extract 64 harmonics from a giant FFT to the time it takes to take an inverse FFT of those harmonics to reconstruct the profile.
I should say that my initial feeling was that the inverse FFT would dominate the time - after all, even an n log n algorithm requires a fair number of floating-point operations to produce a 256-point real inverse FFT. But the output is:
Array reading 1.71528 GB/s
Planning FFT
Running FFTs
FFT time 1.57851e-06 seconds
FFT rate 633510 /s
FFT rate/read rate: 0.176112
That is, yes, the FFTs are the slow step, but only by a factor of five. That is, reading all those coefficients in from memory takes a fifth as long as doing all those FFTs. (Incidentally, if these numbers seem low, the machine I'm running this on is a couple of years old. Edit: it's not the machine pictured above, which is even older, and which does most of my number-crunching.) Here's the code:
#include <stdio.h>
#include <stdlib.h>
#include <time.h>
#include <complex.h>
#include <fftw3.h>
const int repeats=20;
const int array_size=1<<26;
const int irfft_size=256;
const int fft_batch=1<<18;
int main(int argc, char*argv[]) {
double t, tnew;
float*array;
double sum;
double array_rate;
int i,j,k;
struct timeval start, end;
fftwf_plan plan;
fftwf_complex *in;
float *out;
array = (float*)malloc(array_size*sizeof(float));
if (!array) {
perror("Allocation failed");
return 1;
}
sum = 0;
t = 1e100;
for (j=0;j<repeats;j++) {
gettimeofday(&start,0);
for (i=0;i<array_size;i++)
sum += array[i];
gettimeofday(&end,0);
tnew = end.tv_sec-start.tv_sec+(end.tv_usec-start.tv_usec)/1e6;
if (tnew<t) t=tnew;
}
printf("Array reading time %g seconds\n", t, sum);
array_rate = array_size*sizeof(float)/t;
printf("Array reading %g GB/s\n", array_rate/(1<<30));
free(array);
in = (fftwf_complex*) fftwf_malloc(sizeof(fftwf_complex)*(irfft_size/2+1));
out = (float*) fftwf_malloc(sizeof(float)*irfft_size);
printf("Planning FFT\n");
plan = fftwf_plan_dft_c2r_1d(irfft_size, in, out, FFTW_MEASURE | FFTW_EXHAUSTIVE | FFTW_DESTROY_INPUT);
printf("Running FFTs\n");
t = 1e100;
for (j=0;j<repeats;j++) {
gettimeofday(&start,0);
for (i=0;i<fft_batch;i++) {
for (k=0;k<(irfft_size/2+1);k++) {
in[k] = 0;
}
fftwf_execute(plan);
}
gettimeofday(&end,0);
tnew = end.tv_sec-start.tv_sec+(end.tv_usec-start.tv_usec)/1e6;
if (tnew<t) t=tnew;
}
printf("FFT time %g seconds\n", t/fft_batch);
printf("FFT rate %g /s\n", fft_batch/t, sum);
printf("FFT rate/read rate: %g\n", (fft_batch/t)/(array_rate/(2*sizeof(float)*(irfft_size/4))));
fftwf_destroy_plan(plan);
fftwf_free(in);
fftwf_free(out);
return 0;
}
Compiled with:
gcc -O9 -march=native -ffast-math -lfftw3f -lm timer.c
What this tells me is interesting. On the one hand, if I can do something really clever to make the FFTs faster, or avoid them, I can get some improvement, but sooner or later I'm going to hit the limit of memory loading. On the other hand, if I can't make them faster or fewer - and I probably can't - there's not much point sweating much over reducing the memory loads.
Anyway, the upshot of all this is: on modern hardware, you can do an awful lot of flops - a 256-point real FFT - for not much more than the cost of loading the data in from main memory. So if you have some clever mathematical trick to reduce your data size (interpolation, say) it may be worth implementing.
Full post
Subscribe to:
Posts (Atom)